How Pre-Snap Data Influences Play Type and EPA in the NFL
Estimated Read Time - 10 minutes
The NFL hosts the "Big Data Bowl" annually, offering fans eight weeks of detailed play-by-play and player tracking data (this year for 2022). Using this data, I aim to explore how predictable each team's play-calling is and evaluate the success of those predictable plays. Additionally, I’ll discuss potential use cases of this metric in both opponent and self-scouting.
Definitions:
General:
Expected Points Added Per Play (EPA Per Play) measures how much a specific play contributes to a team's chances of scoring.
Personnel: the specific group of players on the field playing for the offense.
Formation: How the players are aligned on a given play.
More on formations https://www.brucey.net/nflab/howtoplay/formation.html
Data Specific:
In this project, down-and-distance is grouped into three categories for 1st and 2nd downs and four categories for 3rd and 4th downs:
1st/2nd: Long = 8+ yards, Medium = 4-7 yards, Short = 0-3 yards
3rd/4th: Long = 8+ yards, Medium = 4-7 yards, Short = 1-3 yards, One = 0-1 yard
**Predictable Plays**: A play is considered predictable if it results in a run or pass more than 80% of the time. At the team level only situations with six or more plays are included.
Theory:
To be a successful offensive play caller in the NFL you must be good at manipulating defenses to create advantageous looks, putting your players in the best possible position. To do this successfully coordinators have learned a long set of rules and heuristics to best decide which plays to run based on the chances of a defense being in a certain formation or coverage.
Typically, with pre-snap motion and the ability to observe defensive alignment, the offense can better predict the defense's intentions, allowing them to adjust to more effective plays and improve post-snap efficiency. But what if defenders could also gain knowledge pre-snap, thus leveling the playing field?
This led me to wonder whether play callers are too predictable in certain situations, offering glaring tells to the defense based on down-and-distance, personnel, and formation/alignment.
Most Predictable Situations - League Wide
To determine which situations are predictable, I first created a metric to define what constitutes a situation. A situation includes all plays with a unique down-and-distance, offensive formation, and receiver alignment.
Here’s an example:
I deemed a situation predictable if it led to a pass or run 80% or more of the time and if the league ran 15 or more plays from that formation.
By excluding obvious passing situations (second/third and long) as well as Empty formations, we get the visualization below. Empty formations were excluded because they are a conscious choice by the offense, forcing the defense to declare their assignments pre-snap.
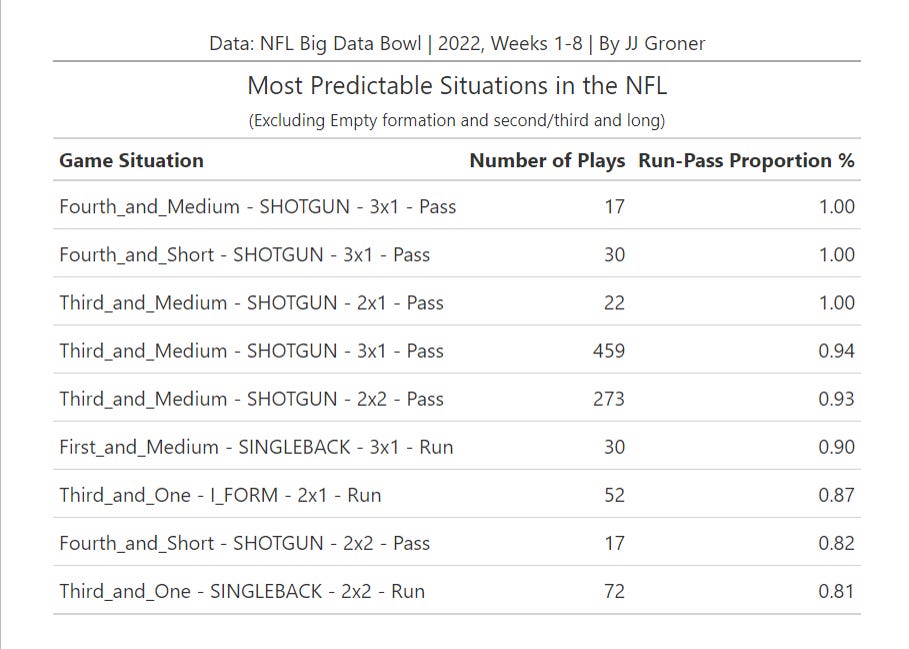
Offenses in shotgun formations on 3rd or 4th and medium or shorter almost always have a pass called. This can be especially useful for linebackers, who no longer need to worry about filling run gaps. Instead, they can quickly drop into their zone, align better in man coverage, or blitz without concern for a run play.
Most Predictable Situations - Team Level
This analysis can also be applied at the team level. Given the smaller sample sizes, I defined a play as predictable if it occurred in a formation with 6 or more snaps. Here’s an example for the Steelers:
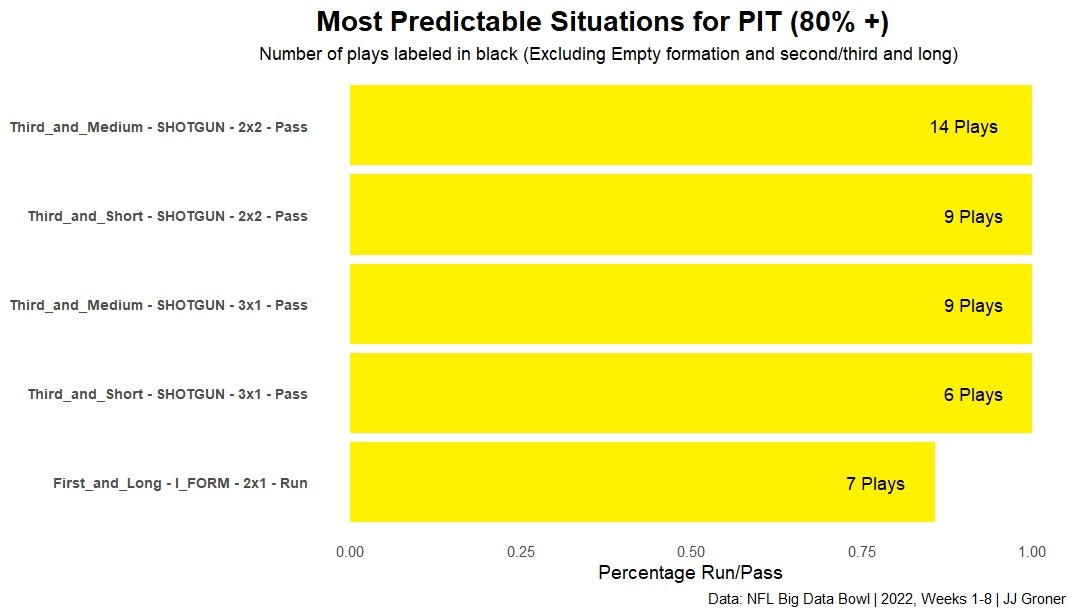
Similar to the league-wide trend, shotgun formations on third and medium/short distances appear to strongly signal a pass. Although the sample size is small (between 6 and 14 plays), consistently opting to pass in these situations could be a schematic oversight that defenses might exploit as the season progresses.
EPA on Predictable vs. Unpredictable Plays
We can also compare each team's predictable situations to their unpredictable ones.
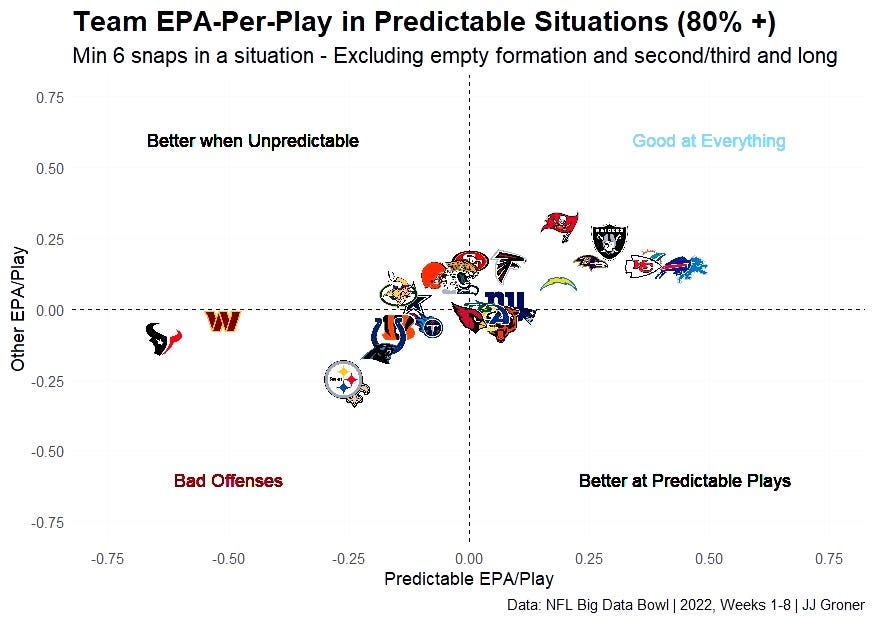
This metric appears potentially predictive, as the Texans, Commanders, Steelers, and Saints—all of whom have new play callers in 2024—ranked lowest in predictable situations. Notably, these teams also ranked in the league's bottom quartile for less predictable situations, suggesting that structural changes were likely necessary regardless.
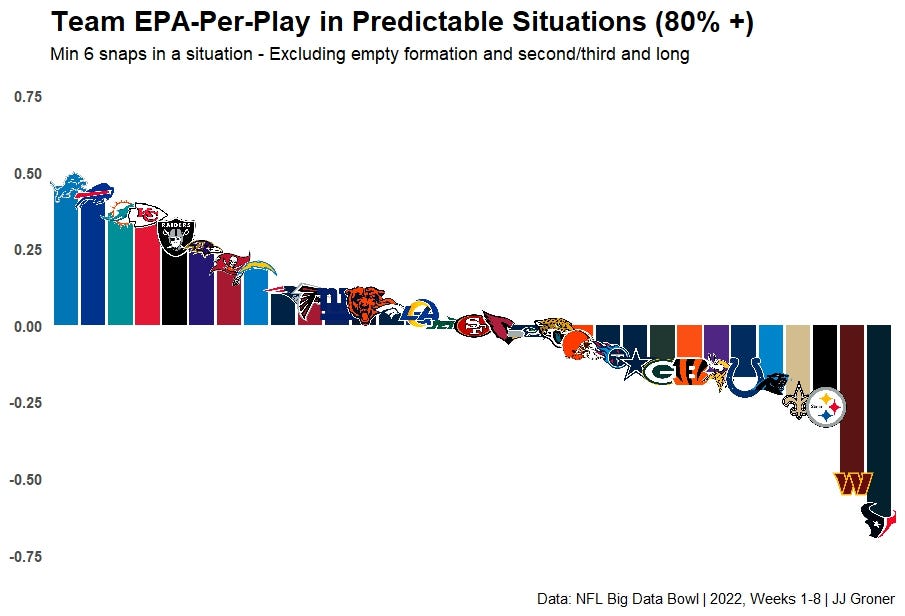
The distribution of predictable EPA per play is much wider than the distribution for 'other plays.' While this is partly due to small sample sizes for some teams, it may also highlight offenses with a limited play-calling foundation that have become stagnant (e.g., Texans, Commanders). Conversely, it may indicate teams with the ability to succeed even in predictable situations (e.g., Buccaneers, Ravens, Dolphins, Chiefs, Bills, and Lions). Notably, all these teams had above-average passing offenses, except for the Raiders, who stand out as an outlier.
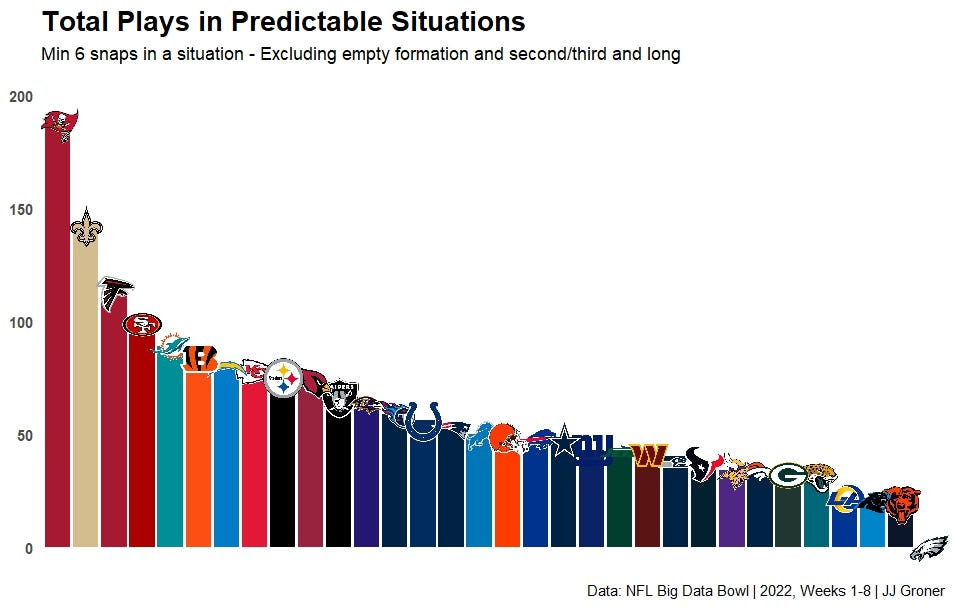
Examining play counts further reveals the story. If you're an Eagles fan wondering why they weren’t included in the previous chart, it's because the Eagles had zero predictable plays through Week 8, while Tampa Bay had over 175. This contrast highlights the different offensive approaches: Tampa Bay often relied on Brady’s ability to read defenses, sacrificing pre-snap variety, while the Eagles leveraged Jalen Hurts' dual-threat capability as a runner.
Here is a graph focusing solely on predictable situations.
Conclusion and Further Research
Across the league, defenses can exploit predictable situations to react more quickly. This is especially advantageous for linebackers, allowing them to fill run gaps more aggressively or move into their zones faster. Such insights can also assist teams in self-scouting, helping them identify patterns to become less predictable and incorporate new wrinkles into familiar concepts.
One current limitation in my definition of a 'predictable' play is that it includes the first time a team runs a play, even though it’s rarely predictable at that point. In the future, I plan to refine this metric to include only plays run more than five times, with the hope that this will reveal a more pronounced change in EPA.
Eventually, this analysis could be conducted at the game level by examining the EPA of plays that have been repeated multiple times during a game. To do this, we’ll need to classify plays using player tracking data, as situation-based metrics often have sample sizes too small for accurate analysis.
I’m also hoping to:
Research how motion can be utilized as a predictor of play type.
Further examine the differences in EPA between predictable running plays and predictable passes.
Model the expected pass/run rate of a situation and compare it with team trends, creating a situationally based pass/run rate over expected model that factors in personnel, formation, and down-and-distance.
References and Acknowledgments
Substack. (2024). Kevin Cole. Substack.com. https://substack.com/@unexpectedpoints
NFL Big Data Bowl 2025. (2024). @Kaggle. https://www.kaggle.com/c/nfl-big-data-bowl-2025/overview
tejseth. (2021). nfl-r-tutorials/mfans.R at master · tejseth/nfl-r-tutorials. GitHub. https://github.com/tejseth/nfl-r-tutorials/blob/master/mfans.R